
Planning
Use Cases
Use Case:
Write a Project Assessment Summary Report
Use data to evaluate the performance of your project
Use data to evaluate the performance of your project
Transportation departments are under pressure to perform with tight budgets. When a big project is complete, you need raw data to evaluate how well your money was spent.
A project assessment summary report will go out to the public, department heads, and your partnering organizations.
An effective report will visualize before-and-after traffic metrics to tell a story of what has been achieved.
NJDOT adopted a Tactical-level Asset Management Plan (T-LAMP) for better project and program development, and to demonstrate to senior leadership, legislators and the public effective, transparent funding expenditures with positive performance results.
NJDOT’s Bureau of Systems Planning developed a T-LAMP Congestion Relief Investments document, that in part laid out 10-year performance targets, measures and objectives for investing $200M/yr in Infrastructure, ITS and TMA/TDM assets.
A Project Assessment Summary process was also developed to systematically evaluate various congestion relief projects and ascertain their effectiveness in reducing congestion and delay, that then would be used to show progress towards targets and objectives.
NJDOT selected the I-80/Squirrelwood Road Interchange project as a test case, and used Probe Data Analytics Suite tools to conduct a before and after study. The resultant visuals and summaries were then used in a brochure-style communications piece to better engage and inform senior leadership, legislators and the general public.
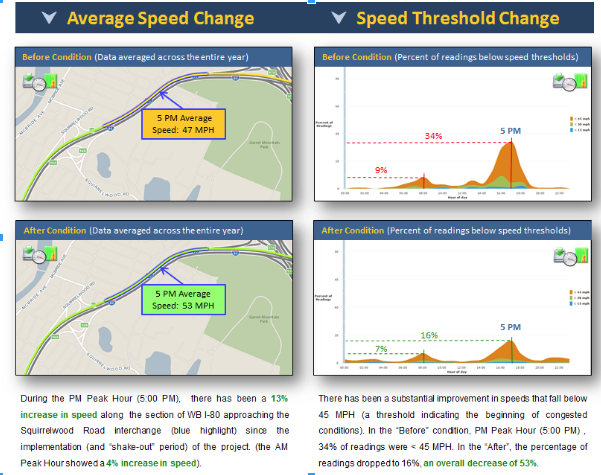
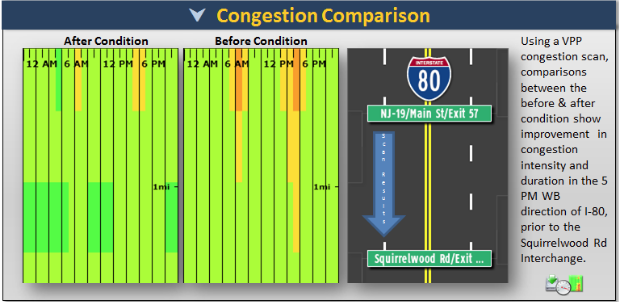
To start, Region Explorer was used to evaluate the average speed, and speed threshold changes to the I-80 mainline just before the interchange, to see what improvements were realized from reducing intersection queuing that backed onto the I-80, impeding mainline flow during the PM peak period. Significant increases in speeds were seen, along with a substantial improvement in speeds that fall below 45 MPH (congestion threshold).
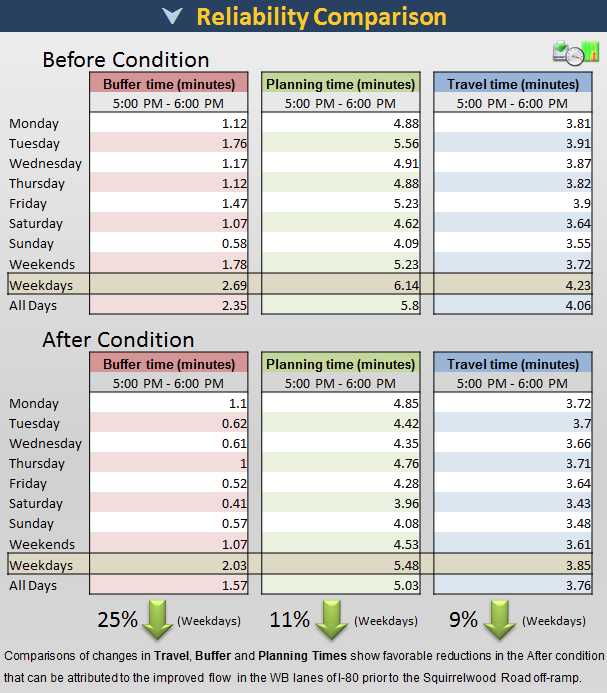
Performance Summaries was used to determine differences in Buffer Time, Planning Time and Travel Time along I-80 WB due to the project. Results showed improvements in all three measures for weekends, weekdays and all days of the week.
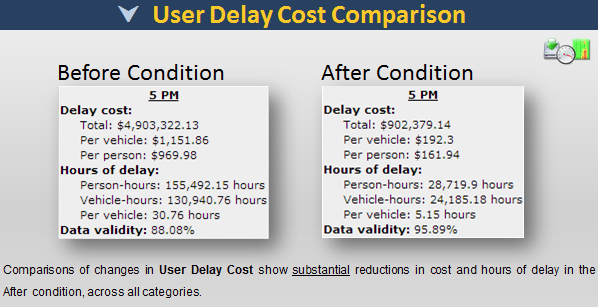
Finally, User Delay Cost Analysis was used to compare cost and delay measures before and after the project. Again, significant savings in costs and delays to travelers were realized from the implementation of the project.
The NJDOT realized many benefits from this holistic project evaluation process:
