
Operations
Use Cases
Use Case:
Conduct an After-Action Review
When your department reacts to a major incident, an after-action review is a chance to look back and document what happened
When your department reacts to a major incident, an after-action review is a chance to look back and document what happened
After-action Reviews are a cornerstone of State’s TSM&O and TIM programs, providing agencies with actionable intel on an incident or event that can be used for better management strategies for future occurrences, demonstrate the benefit of quick clearance practices and improve cross-agency coordination and communication.
Using RITIS can provide the hard data analytics to develop event profiling for after-action reports: how long did it take to respond to and clear the incident? Were the rescue vehicles dispatched a good fit for the job? Were the messages displayed on digital signs accurate and helpful? How much delay occurred? What roads were affected? And what was the cost to travelers?
Answering these questions help you quantify performance impacts to your roadway system, identify improvements to your Standard Operating Procedures (SOP) and justify requests for additional funding, positions, and equipment.
We’ve collected a few examples about how transportation agencies have used RITIS to collect data and create visualizations for their after-action reviews, to help clearly covey their message about TSM&O / TIM program effectiveness to senior leadership, government officials and the public.
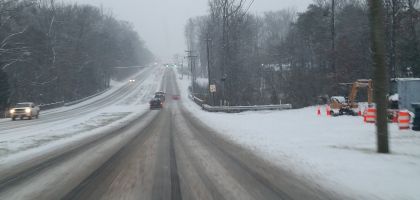
In the afternoon peak hours on Wednesday, January 20th 2016, a sudden and unexpected snow hit cold road surfaces in and around the National Capital Region. This resulted in only about an inch of accumulation, but created icy surface conditions, resulting in extremely hazardous driving conditions that lasted 17 hours before the situation returned to normal.
MWCOG (a regional partnership in the National Capital Region) used PDA Suite for an After-action Review to ascertain the transportation impacts of the clipper system that affected the Washington region.
Let’s look at their most important process for preparing for their after-action review:
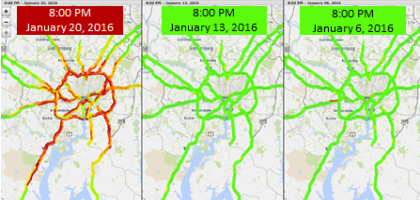
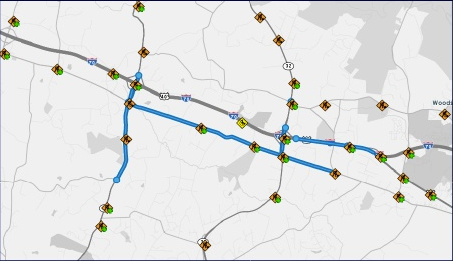
Trend Map visualizes the impact of the storm to the NCR roadways compared to normal traffic conditions, using animated performance mapping. This helps highlight areas of severe congestion and delay spatially and temporally, to help develop better procedures and mitigation strategies for future events.
PDA Suite-generated results were used to develop a technical memorandum in support of after action reviews by NCR Transportation Planning Board decision-makers, ensuring a thorough understanding of the event, its impacts and how to be better prepared for similar future events. It also improved operational strategies, such as increased Safety Service Patrol coverage, targeted salting operations, more concise DMS messages, and better interagency communication and coordination.
 I-70 Fatality Incident
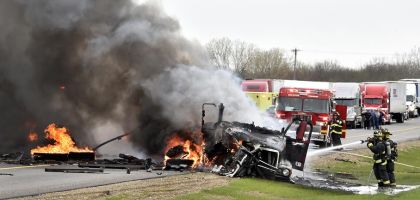
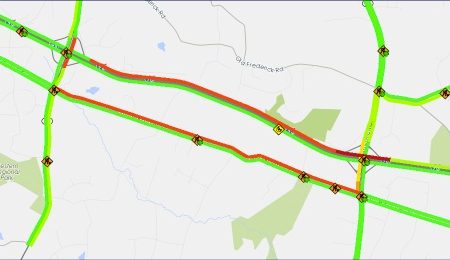
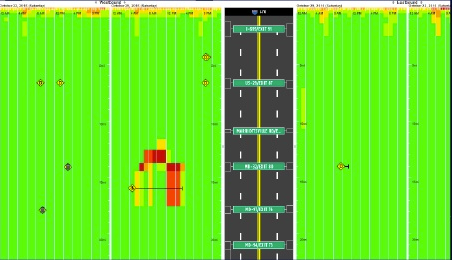
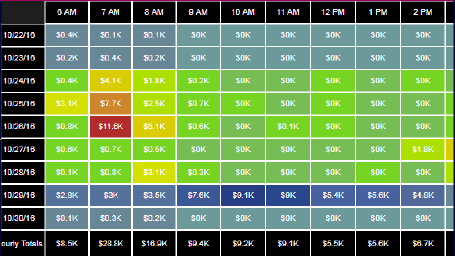
On Saturday, October 29, 2016 at around 4:30 AM, a car traveling on I-70 WB hit a deer, then a tractor trailer hit the car and jack-knifed, resulting in one fatality. All lanes were closed in the WB direction for over 7 hours, it took about 11 hours to fully clear the incident and reopen all lanes.
MDOT led an after-action review with its partner agencies to study how the incident affected area traffic, and how well the responding teams were able to clear the incident and restore roads to normal conditions.
Let’s look at their three main processes for preparing for their after-action review:
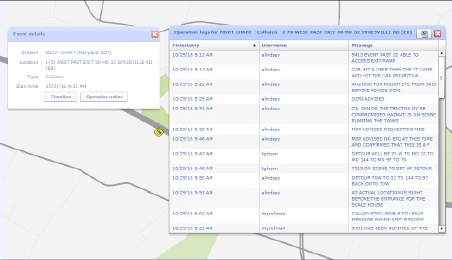
Quick, comprehensive data access, analysis and report-ready results help make the after-action review more timely, comprehensive and relevant.
Clear, concise results provide the visuals to show Quick Clearance Practice and TSM&O Program effectiveness.
Thoroughly documented results provide increased chances for funding, positions and equipment.
All the above helped persuade internal & external partners to improve current practices.
